Velocis
Designing a connected network management ecosystem that empowers both internet service providers and their customers.
Internet service providers often rely on fragmented operational tools while customers have limited visibility into their network usage, billing, and support requests. Velocis connects provider operations with customer self-service through two integrated platforms that improve visibility, reduce support overhead, and create a more transparent service experience.
Responsibilities
Scope of work across strategy, structure, and interface design
- UX Research
- Information Architecture
- User Flows
- Wireframing
- UI Design
- Design System
- Interactive Prototype
Primary Users
User groups the platform was designed to support
- Residential Customers
- Customer Support Teams
- Network Operations Teams
- Service Administrators
Impact Stats
Give customers complete transparency into usage, billing, and services.
Help providers manage network performance from one centralized dashboard.
Reduce support requests through better self-service experiences.
Bridge customer and provider experiences through one unified platform.
Internet providers and customers often operate through disconnected systems, resulting in poor visibility, unnecessary support requests, and fragmented experiences. Velocis was designed to connect both sides through one integrated ecosystem.
The Problem
Disconnected systems reduced transparency and slowed service workflows
Customers struggled to understand their network usage while providers relied on disconnected operational systems to manage services.
- Limited customer visibility
- Manual support requests
- Fragmented provider tools
- Difficult service management
- Poor operational transparency
The Solution
Two connected platforms for one seamless service ecosystem
Velocis introduces two connected platforms that combine customer self-service with provider operations, creating a seamless experience for managing networks, services, and support.
- Unified provider dashboard
- Customer self-service portal
- Live network visibility
- Connected support workflows
- Centralized service management
Design Constraints
Balancing operational complexity with customer simplicity
Designing for telecommunications required balancing operational complexity with customer simplicity.
- Constraint 01
Network Data Volume
Large amounts of network data had to remain clear and actionable.
- Constraint 02
Role Diversity
Multiple user roles required different depth with shared consistency.
- Constraint 03
Real-time Monitoring
Critical network updates required fast visibility and rapid response.
- Constraint 04
Technical Language
Technical terminology had to be understandable for non-expert users.
- Constraint 05
Information Density
High-density operational views needed clear hierarchy and scanability.
- Constraint 06
Cross-platform Consistency
Customer and provider products needed one coherent design language.
Success Metrics
Expected outcomes used to validate product direction
These KPI cards represent expected outcomes rather than measured analytics.
User Journey
How Velocis improves each stage of the service experience
- Stage 01
Monitor Usage
Customers gain instant visibility into consumption and service status.
- Stage 02
Receive Alerts
Timely alerts help users and teams act before issues escalate.
- Stage 03
View Billing
Transparent billing reduces confusion and repetitive support queries.
- Stage 04
Request Support
Self-service flows simplify issue reporting and request tracking.
- Stage 05
Issue Resolution
Connected workflows help teams resolve incidents faster.
- Stage 06
Service Optimization
Operational insight supports better network and plan decisions.
Before Velocis
Disconnected systems created operational and customer friction
- Multiple disconnected provider systems
- Limited customer visibility
- High support dependency
- Manual administration
- Poor operational transparency
After Velocis
One ecosystem connecting customer and provider workflows
- Connected provider dashboard
- Customer self-service
- Live monitoring
- Faster issue resolution
- Better customer experience
Design Process
From service research to scalable ecosystem decisions
A structured process focused on resolving friction across customer self-service and provider operations.
- Step 01
Research
Understand customer pain points, provider operations, and service management workflows.
- Step 02
Problem Definition
Identify friction across customer support and provider administration.
- Step 03
Information Architecture
Organize monitoring, billing, support, services, and analytics into scalable navigation structures.
- Step 04
Interface Design
Design connected experiences for both customer and provider platforms.
- Step 05
Prototype & Iterate
Validate workflows and continuously improve usability.
User Personas & Needs
Understanding the primary users, their motivations, challenges, and how the product supports their goals.

Residential Customer
Uses internet services daily and expects reliable connectivity.
Goals
- Monitor usage
- Manage subscriptions
- Resolve issues quickly
Pain Points
- Limited visibility
- Slow support
- Confusing billing
Needs
- Usage dashboard
- Self-service
- Transparent billing
Primary Tasks

Customer Support Specialist
Resolves customer issues and service requests.
Goals
- Resolve issues
- Access customer information
- Reduce response times
Pain Points
- Fragmented records
- Manual troubleshooting
- Limited history
Needs
- Unified customer profile
- Support workflow
- Service timeline
Primary Tasks

Network Operations Engineer
Monitors network infrastructure and system health.
Goals
- Detect outages
- Monitor network health
- Maintain uptime
Pain Points
- Multiple systems
- Alert fatigue
- Limited visibility
Needs
- Monitoring dashboard
- Real-time alerts
- Network analytics
Primary Tasks

Service Administrator
Manages customers, subscriptions, billing, and configurations.
Goals
- Simplify service management
- Reduce admin work
- Improve efficiency
Pain Points
- Manual provisioning
- Disconnected administration
- Repetitive tasks
Needs
- Workflow automation
- Centralized administration
- Service management
Primary Tasks
Design Principles
Principles Guiding Product Design
- Simplify technical information.
- Promote transparency.
- Reduce support dependency.
- Keep provider workflows efficient.
- Build one connected ecosystem.
Information Architecture
Two products, one connected ecosystem
The platform structure separates customer self-service from provider operations while maintaining a shared design language that allows both products to work together seamlessly.
Customer Platform
- Dashboard
- Internet Usage
- Active Plan
- Billing & Payments
- Devices
- Support
- Notifications
- Profile & Settings
Provider Platform
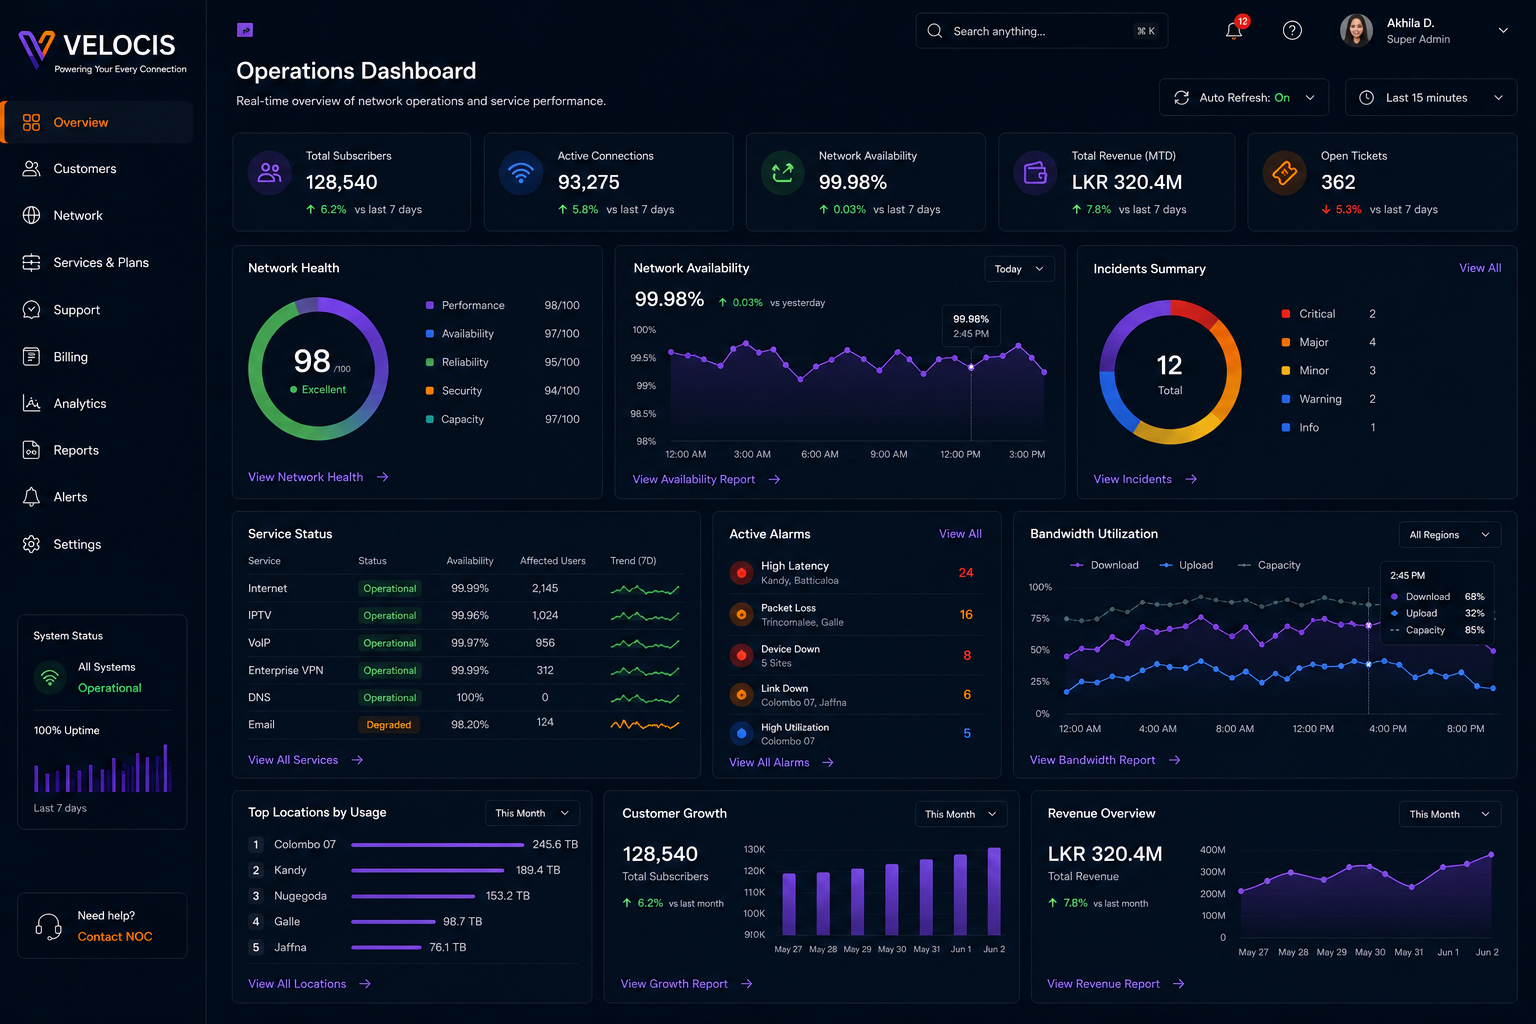
- Operations Dashboard
- Customers
- Service Plans
- Network Monitoring
- Support Tickets
- Billing Management
- Analytics
- Notifications
- Administration
Key Features
Capabilities that connect customer self-service and provider operations
Each feature reduces operational friction while improving transparency and control.
Network Dashboard
Provide providers with a real-time overview of network health and operational metrics.
Customer Portal
Allow customers to monitor usage, billing, subscriptions, and support requests independently.
Usage Analytics
Transform technical network data into understandable insights.
Service Management
Manage subscriptions, packages, and customer services through one platform.
Support Center
Reduce operational overhead by improving self-service experiences.
Operational Analytics
Monitor infrastructure performance through centralized dashboards.
Design Decisions
Decisions made to improve monitoring speed, clarity, and consistency
Each decision balances technical depth for providers with approachable experiences for customers.
Dashboard
Prioritizes network health and operational alerts before secondary metrics.
Progressive Disclosure
Advanced technical information appears only when necessary.
Visual Hierarchy
Critical network status is surfaced before detailed analytics.
Shared Design Language
Both customer and provider platforms share reusable components while supporting different workflows.
Navigation
Persistent navigation reduces context switching across operational tasks.
Accessibility
Readable typography, spacing, and contrast improve usability during extended monitoring sessions.
UI Highlights
Annotated screens showing why each region exists and how it improves transparency, support, and operations.
Design System Overview
Reusable components across customer and provider products
Reusable components maintain consistency across two connected platforms while supporting independent product evolution.
- 01
Buttons
Clear action patterns for support and operational workflows.
- 02
Cards
Scannable summaries for service status and account context.
- 03
Tables
Dense data views for provider-side administration and diagnostics.
- 04
Charts
Network and usage trends translated into actionable insights.
- 05
Badges
Quick signal markers for priority, status, and incident state.
- 06
Status Indicators
Live service and infrastructure health visibility at a glance.
- 07
Forms
Structured flows for support, provisioning, and configuration.
- 08
Navigation
Persistent access across monitoring, customer services, and administration.
Accessibility Considerations
Designed for clarity during extended monitoring and support
- WCAG AA contrast
- Readable typography
- Large click targets
- Keyboard accessibility
- Clear hierarchy
- Consistent spacing
Design Trade-offs
Rationale behind key product architecture decisions
- Why two platforms instead of one? Customers and providers have fundamentally different workflows requiring tailored experiences while maintaining one connected ecosystem.
- Why dashboard-first? Operational teams begin each day by monitoring network health before taking action.
- Why progressive disclosure? Technical networking information should only appear when users need deeper diagnostics.
- Why shared design system? A common design language improves consistency while allowing both products to evolve independently.
Future Opportunities
Roadmap directions for continued ecosystem evolution
These opportunities represent future product evolution beyond the current concept scope.
- Roadmap 01
AI-powered outage prediction
Identify risk patterns early to reduce customer disruption.
- Roadmap 02
Smart troubleshooting assistant
Guide users through issue resolution with contextual support.
- Roadmap 03
IoT device management
Extend service visibility and controls to connected home devices.
- Roadmap 04
Real-time outage notifications
Proactively inform users and reduce support load during incidents.
- Roadmap 05
Predictive maintenance
Support operations teams with proactive infrastructure planning.
- Roadmap 06
Mobile companion application
Enable on-the-go monitoring and service management.
Expected Impact
Outcomes expected from a connected telecom ecosystem
- Improve customer transparency
- Reduce support workload
- Increase operational efficiency
- Simplify service management
- Create a scalable telecommunications ecosystem
Key Takeaways
Lessons that shaped ecosystem and enterprise design decisions
Designing Velocis reinforced several important lessons.
- Enterprise platforms should simplify complex technical systems without sacrificing functionality.
- Self-service experiences reduce operational costs while improving customer satisfaction.
- Shared design systems create stronger product ecosystems.
- Transparency builds trust between service providers and customers.
If I Had More Time
Next steps to evolve Velocis further
With additional time I would continue evolving Velocis through:
- Usability testing with ISP operators
- Customer usability testing
- AI-powered diagnostics
- Mobile companion experience
- Predictive outage monitoring
- Accessibility validation
- Smart network recommendations
Velocis demonstrates how thoughtful product design can connect customers and service providers through one scalable ecosystem that simplifies network management, improves operational efficiency, and builds greater transparency.